Uncovering a Shared Source of Truth for Container Inventory Across Multiple Business Functions
Summary
Maersk manages millions of container movements across depots worldwide. Despite the importance of container availability in operational decision-making, there was no centralized digital visibility into actual depot stock levels. Different business functions relied on fragmented data sources, emails, local knowledge, and assumptions to make critical decisions.
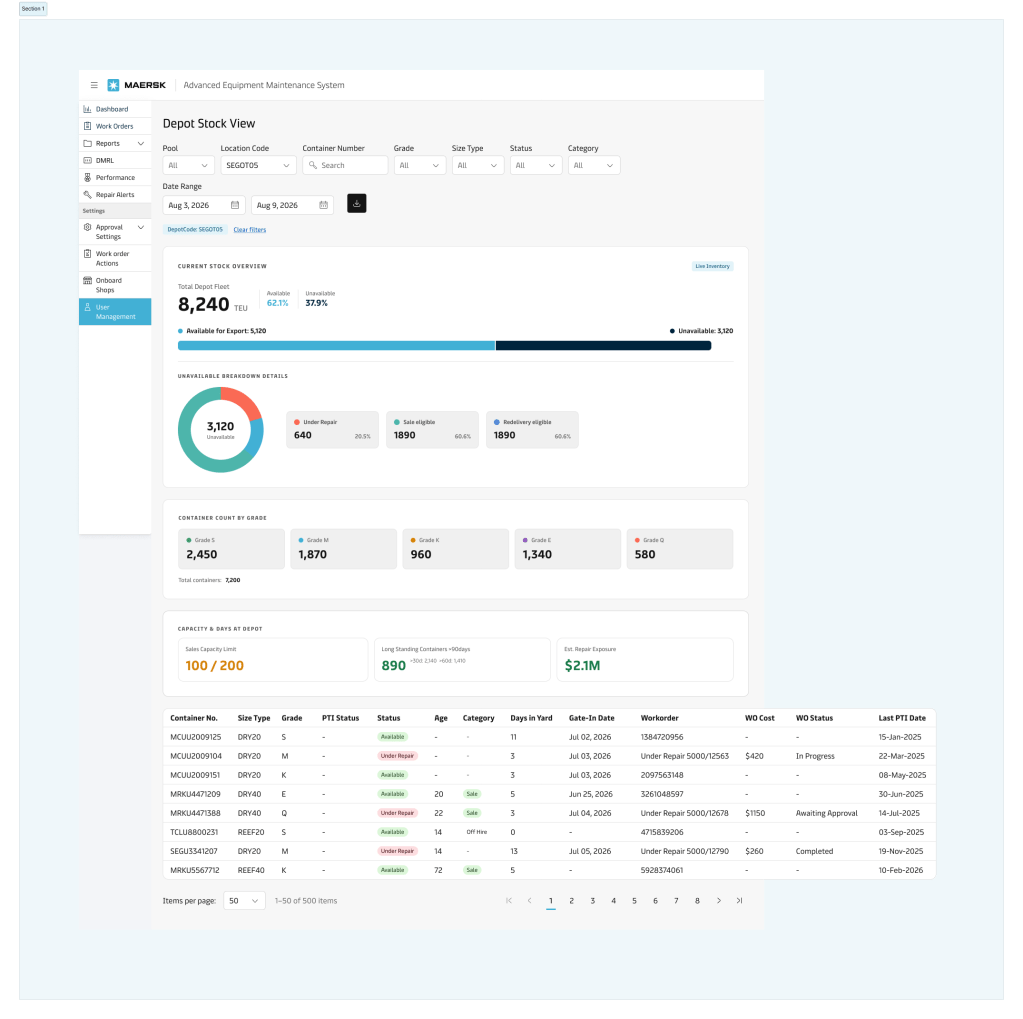
This initiative set out to understand the impact of this visibility gap, identify stakeholder needs, and explore how a Depot Stock View could support multiple user groups operating from the same inventory dataset but with very different business objectives.
Through stakeholder interviews, requirement synthesis, and AI-assisted analysis, the project uncovered a common need for inventory visibility while revealing fundamentally different definitions of “depot health” across teams.
The outcome was an evidence-based foundation for exploring future Depot Stock View concepts capable of serving diverse operational needs through flexible, configurable experiences.
Context
Container inventory sitting inside depots plays a critical role in several operational workflows:
- Equipment allocation
- Booking fulfillment
- Container sales
- Container redelivery
- Equipment maintenance
- Repair approvals
However, depot inventory information was not available through a centralized digital interface.
Teams therefore relied on multiple sources.This created a situation where stakeholders were often making business decisions without visibility into the actual inventory available at a depot.
The hypothesis behind the project was:
If stakeholders had visibility into depot inventory and container status, decisions could become more informed, proactive, and efficient.
Rather than immediately designing a solution, the project focused first on validating whether the problem existed, identifying who was affected, and understanding what information different users required.
Stakeholders
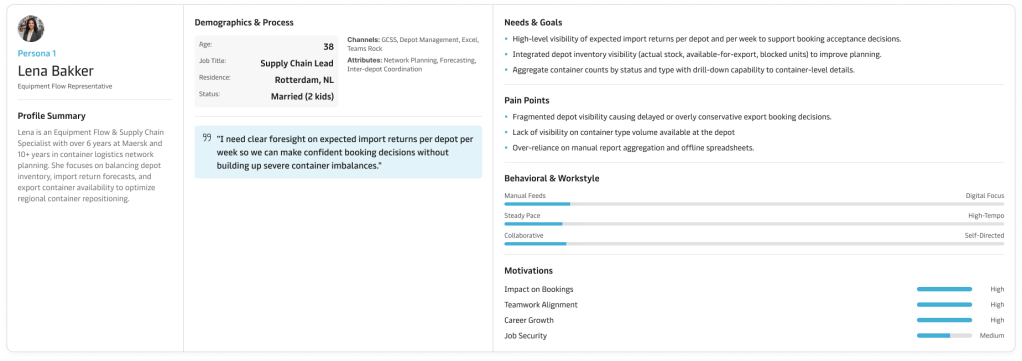
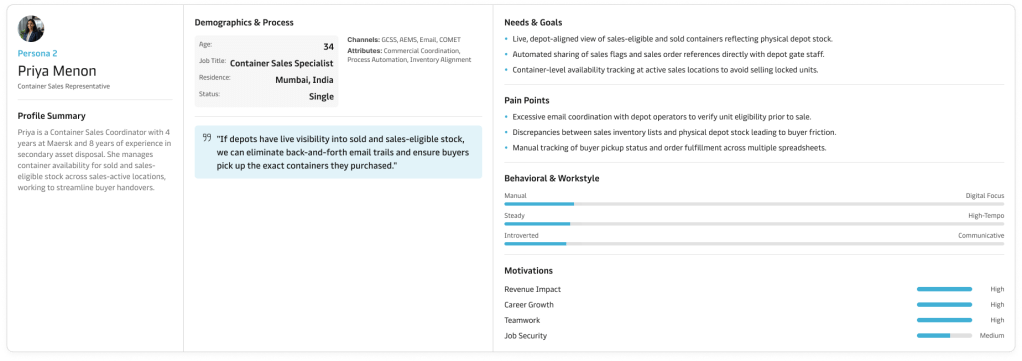
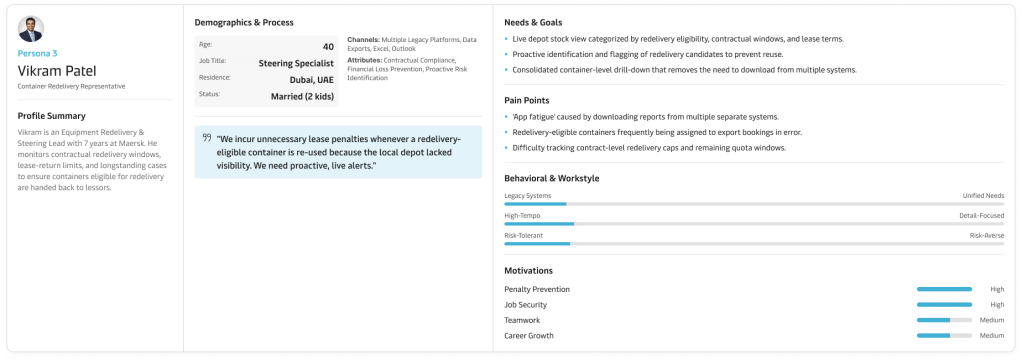
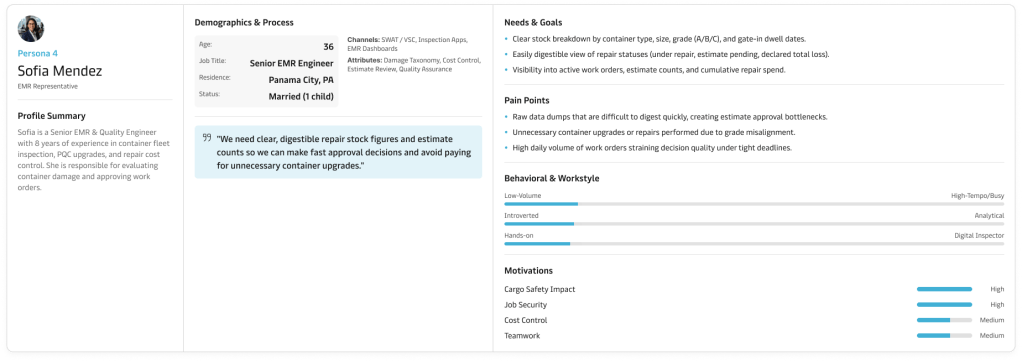
Research uncovered four primary stakeholder groups.
My Role
Senior UX Designer
- Research planning
- Stakeholder interviews
- Interview moderation
- Research synthesis
- Requirement consolidation
- Concept exploration strategy
- Alignment across business functions
Timeline
2 months and ongoing
Tools Used
- MS Copliot agent
- Confluence whiteboard
- Figma Ai
- Design system specific skills
As the sole moderator, I conducted stakeholder interviews and synthesized findings into a structured requirement repository.
Existing ecosystem
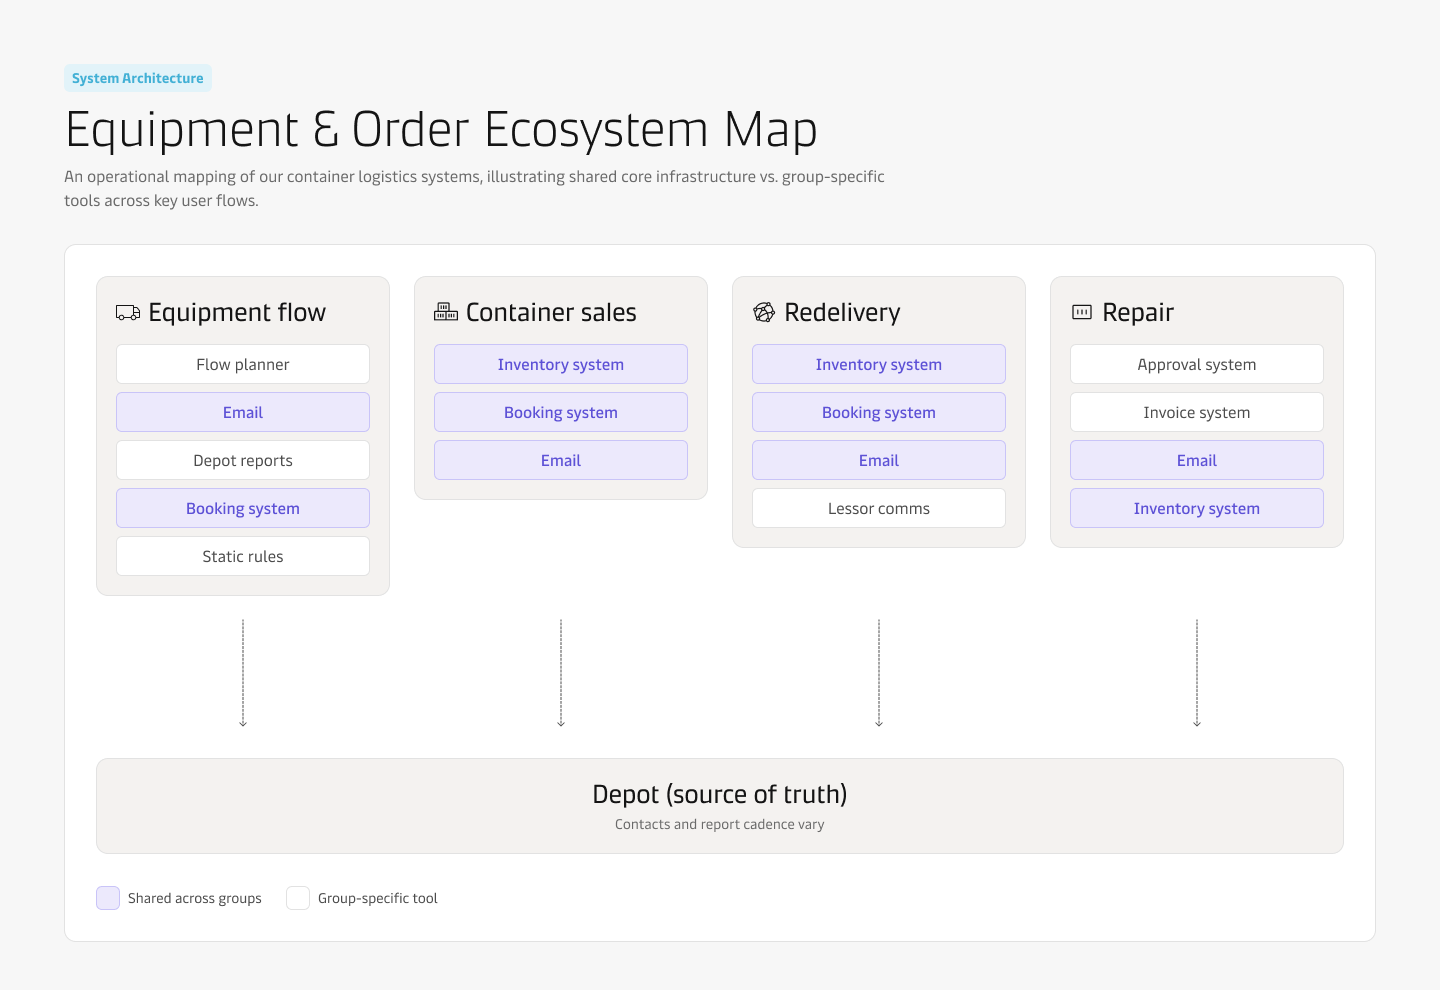
Research Approach
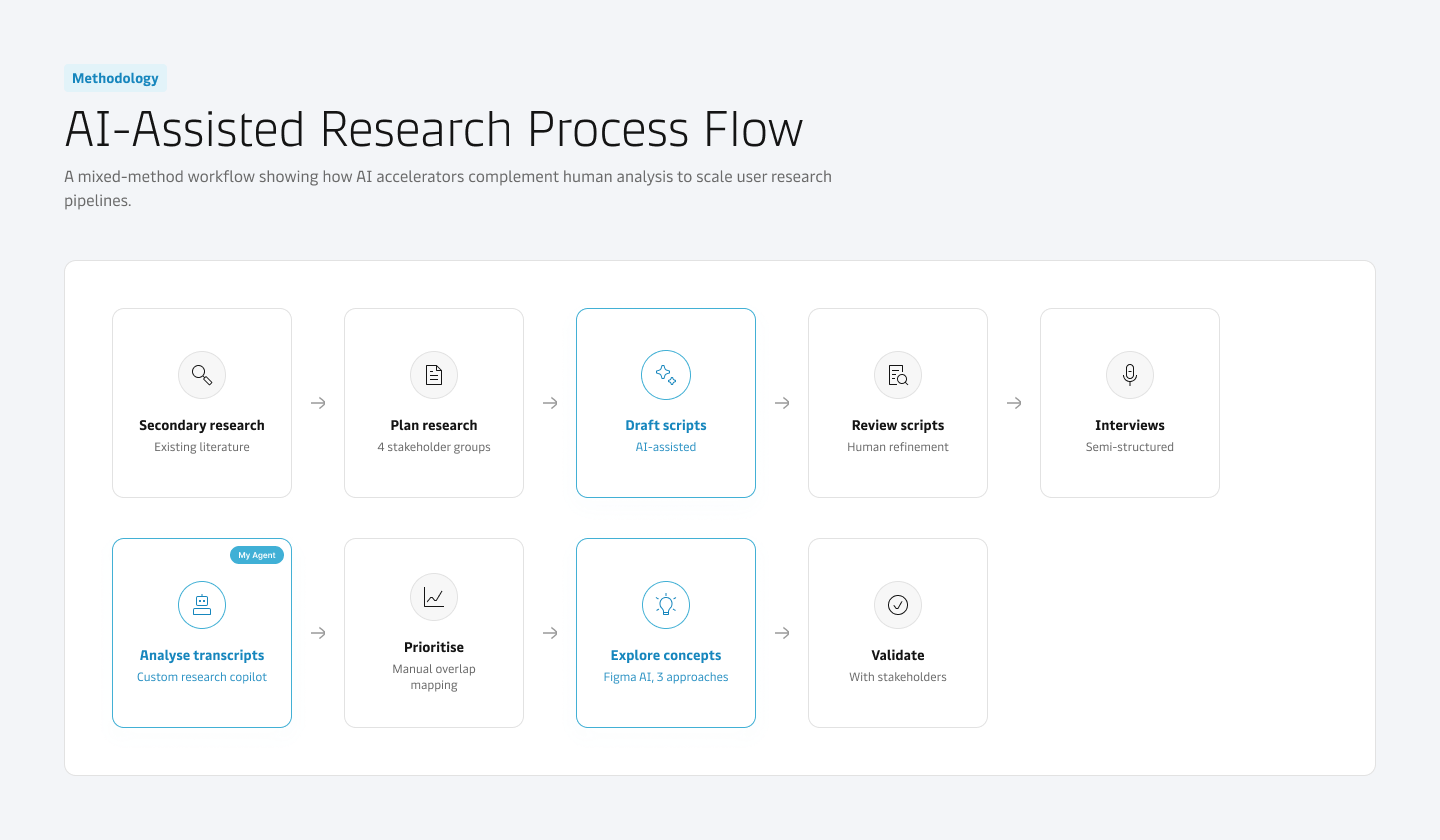
The project followed a discovery-first approach.
Phase 1: Secondary Research
Initial understanding came from existing documentation and stakeholder conversations.
This helped form preliminary hypotheses around:
- Equipment allocation challenges
- Sales inventory visibility
- Redelivery execution
- Repair prioritization
However, these assumptions required validation through direct stakeholder engagement.
Phase 2: Stakeholder Interviews
Semi-structured interviews were conducted across all four stakeholder groups.
Objectives:
Understand
- How decisions are made today
- What information is currently available
- Existing workarounds
Validate
- Whether depot stock visibility is genuinely needed
- Which workflows would benefit
Discover
- Required data elements
- Role-specific mental models
- Potential solution constraints
Phase 3: Solution Concept Reviews
A preliminary concept was introduced to stakeholders.
Feedback focused on:
- Data relevance
- Information hierarchy
- Aggregation versus detail
- Role-specific needs
The goal was not validation of a design but validation of problem-solution fit.
Use of AI
AI played a significant role in accelerating research operations while keeping stakeholder conversations human-led.
AI was used for:
Interview Preparation
- Drafting interview guides
- Exploring hypotheses
- Identifying potential knowledge gaps
Research Synthesis
- Structuring findings from interview transcripts
- Building evidence repositories
- Grouping requirements
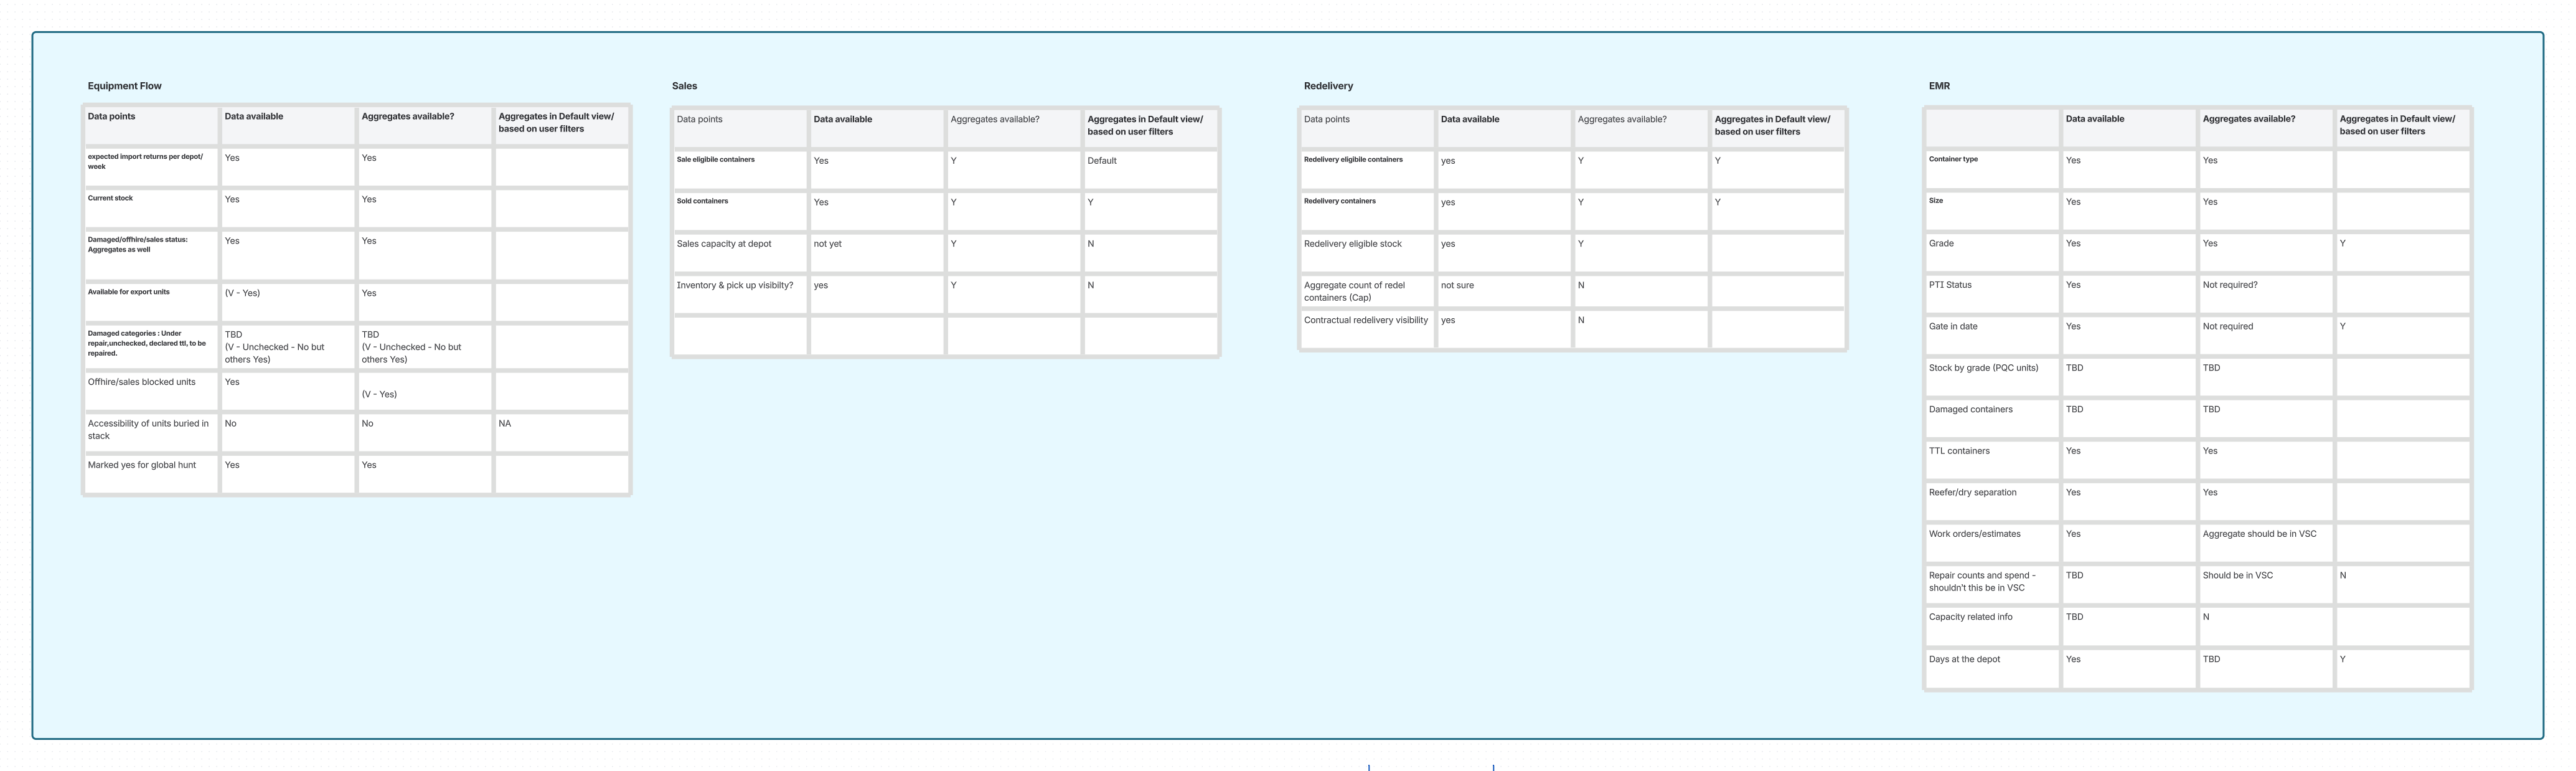
Requirement Mapping
- Identifying common themes
- Detecting overlaps across stakeholder groups
Concept Exploration
- Generating exploratory design prompts
- Identifying opportunities for configurable experiences
Importantly:
AI was used to assist synthesis and exploration, not to replace stakeholder input.
All findings remained grounded in stakeholder interviews.
Key Insights
Insight 1
The Problem Was Not Inventory Visibility Alone
Initially, the assumption was that stakeholders simply needed stock counts.
Research revealed a deeper issue.
Each team required inventory visibility to support different decisions.
Examples:
- Equipment Flow needed availability forecasting.
- Sales needed visibility of sale-designated inventory.
- Redelivery teams needed leased container tracking.
- Repair teams needed inventory context for approval decisions.
The inventory dataset was shared.
The decision-making context was not.
Insight 2
Users Think in Terms of Depot Health
Stakeholders rarely asked for raw inventory numbers.
Instead they wanted answers to questions such as:
- Can this depot support demand?
- Is inventory usable?
- Are sales assets actually out-fleeted?
- Are redelivery opportunities being missed?
The opportunity evolved from:
“Show depot stock”
to
“Help stakeholders assess depot health.”
Insight 3
Aggregate and Detailed Views Are Equally Important
Stakeholders frequently discussed two types of behaviour:
Assessment
Understanding overall depot conditions.
Examples:
- Inventory levels
- Status breakdowns
Investigation
Drilling into individual containers.
Examples:
- Repair candidates
- Sale inventory
- Redelivery opportunities
- Available for export
A successful solution would need to support both.
Insight 4
The Same Inventory Requires Different Lenses
Different teams prioritized entirely different attributes.
Examples:
| Group | Critical Information |
|---|---|
| Equipment Flow | Availability, status, incoming inventory |
| Sales | Sale eligibility, sold status |
| Redelivery | Redelivery eligibility, contractual context |
| Repair | Grade, damage, PTI, repair status |
This suggested that a one-size-fits-all dashboard would likely fail.
Problem Statements
Equipment Flow
How might we help Equipment Flow teams understand actual depot availability so container allocation decisions can be based on current conditions rather than static rules?
Container Sales
How might we help Sales teams identify and manage sale-designated inventory so containers can be sold in a timely manner?
Container Redelivery
How might we help Redelivery teams identify and act on redelivery opportunities before eligible containers are reused in operational workflows?
Equipment Maintenance & Repair
How might we help Repair teams make inventory-aware repair decisions that improve equipment availability while avoiding unnecessary costs?
Solution Direction
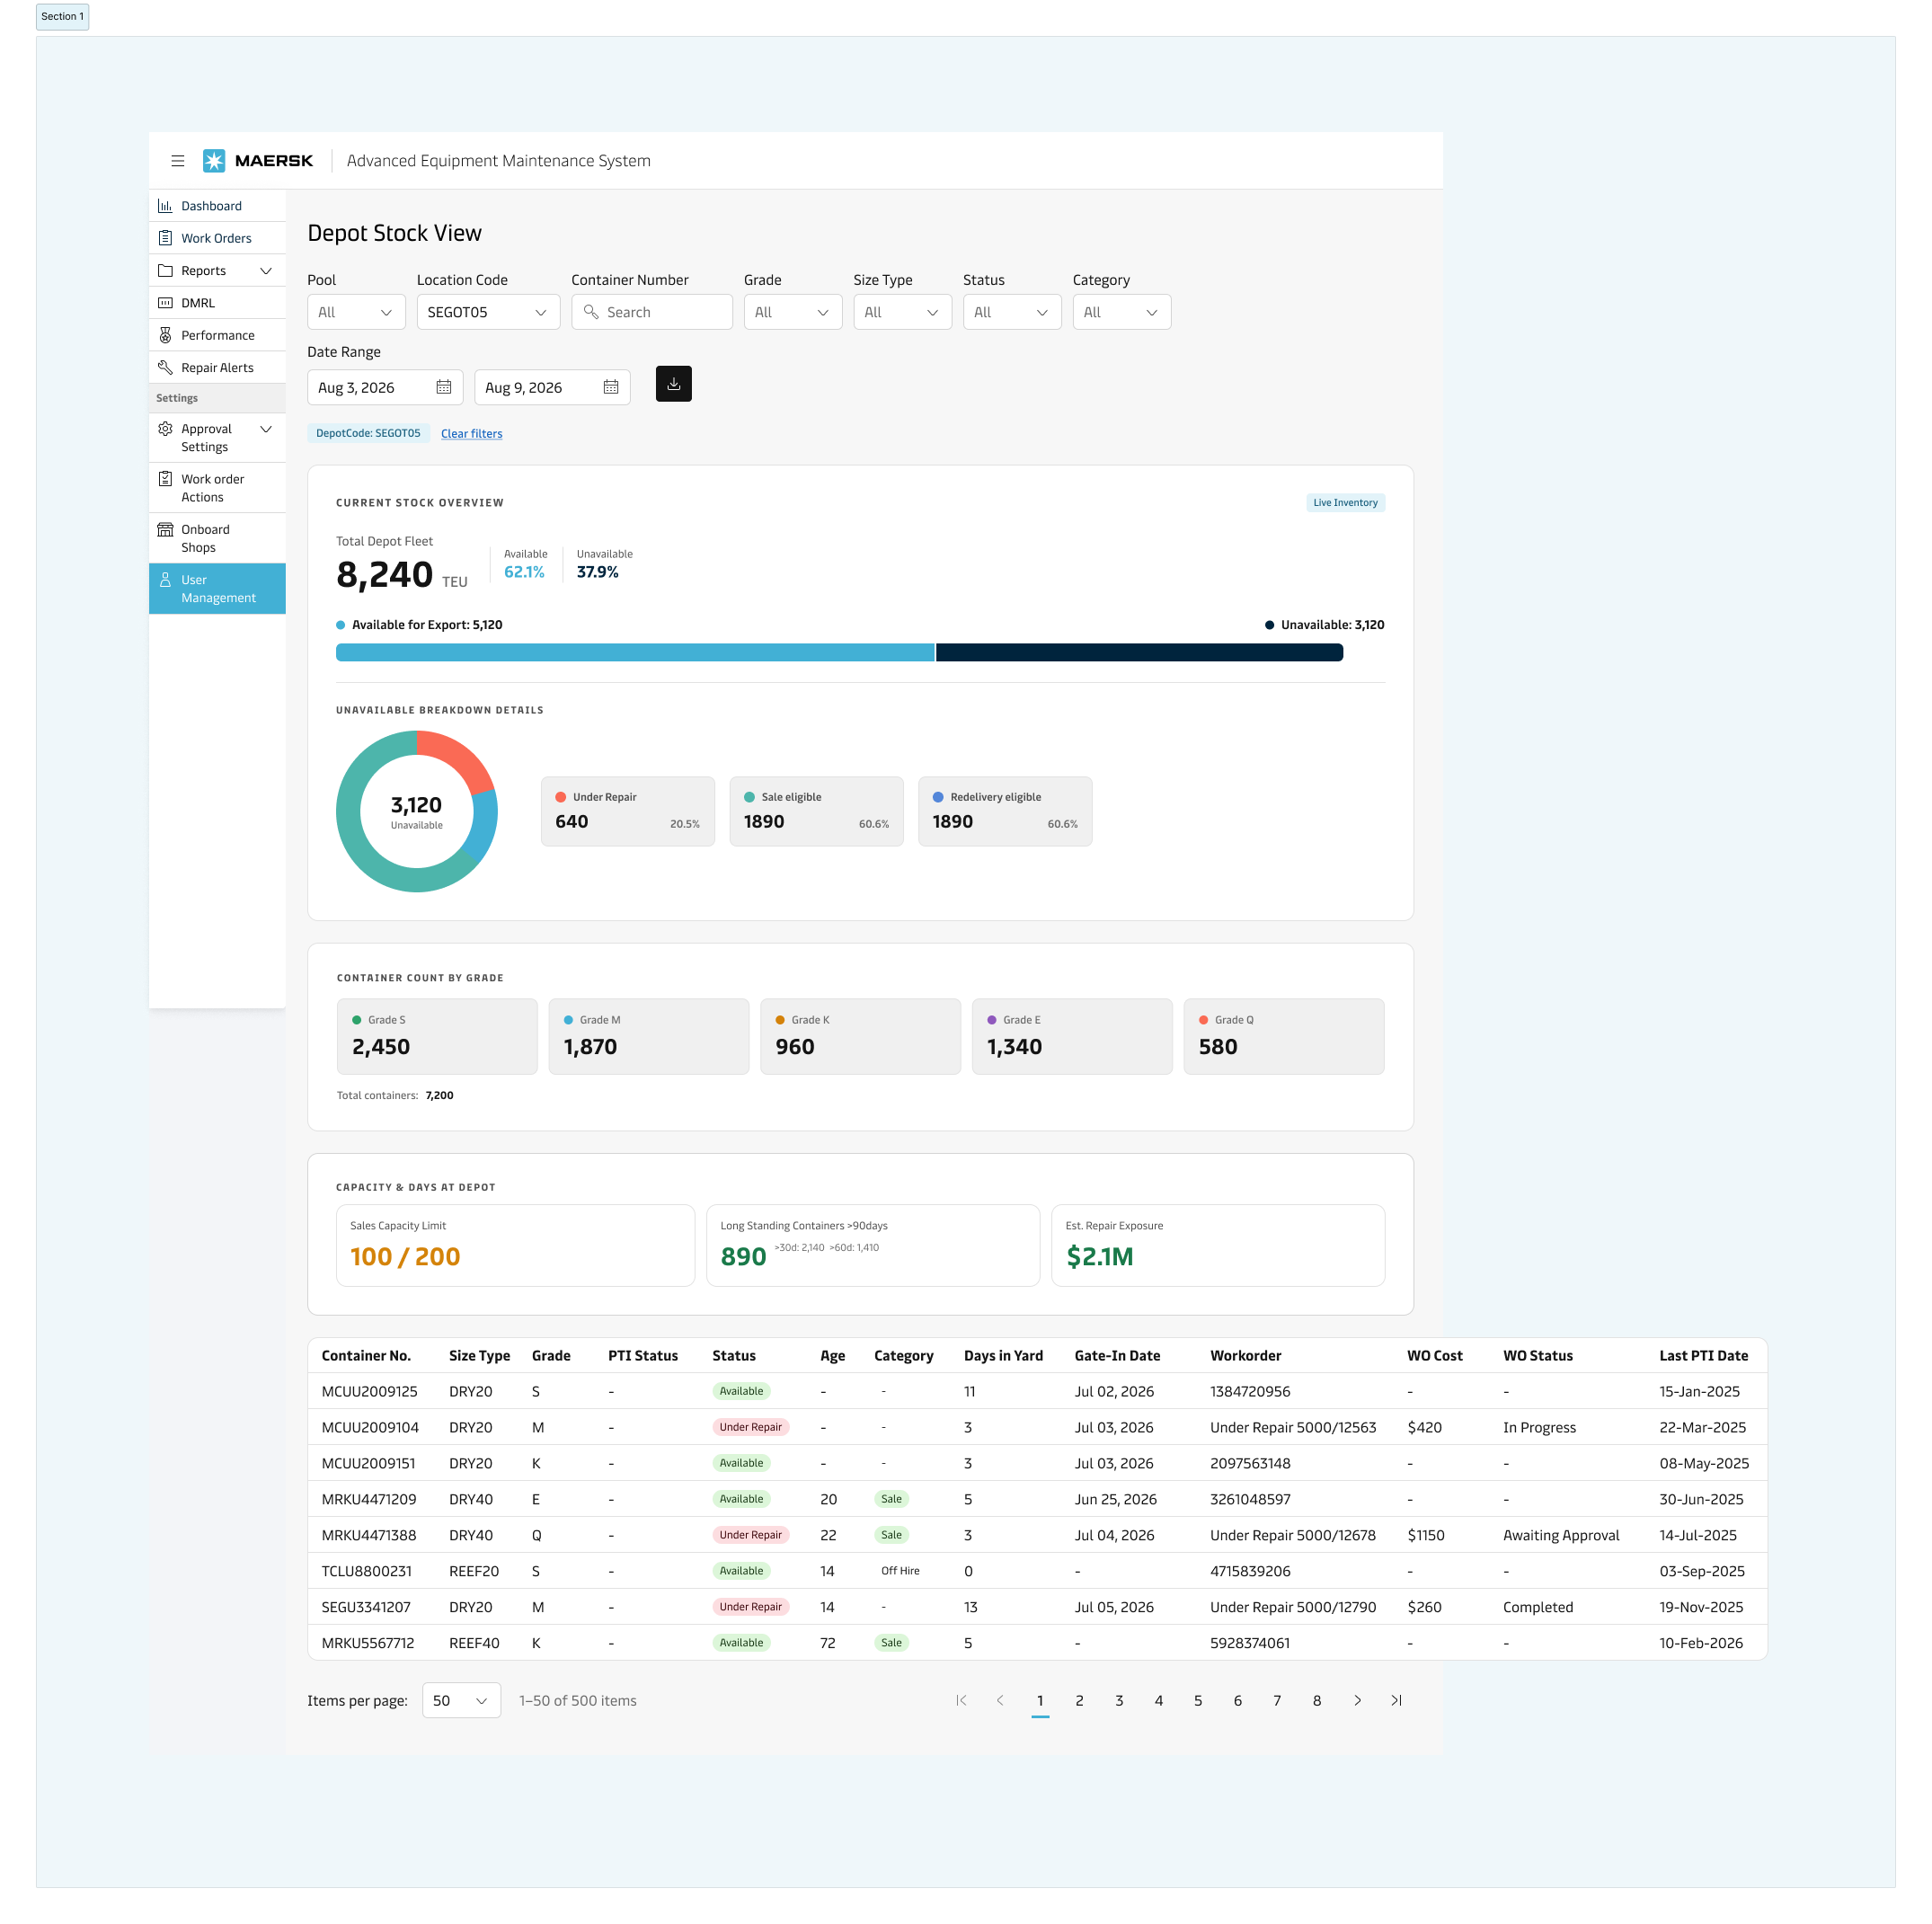
Rather than designing a fixed inventory dashboard, the project moved toward exploring a flexible Depot Stock View capable of supporting multiple mental models.
Exploratory concepts focused on:
Configurable inventory dashboards
Users choose which dimensions and statuses matter most.
Role-based perspectives
Different stakeholder groups see tailored inventory views built on the same dataset.
Depot health model
Users begin with overall depot health indicators and drill into specific operational issues.
Outcome
The project transformed what initially appeared to be an inventory visibility problem into a broader understanding of how different business functions interpret and act on depot information.
Research established:
- Clear evidence of a visibility gap
- Stakeholder-specific information needs
- Shared versus unique requirements
- Common dataset opportunities
- Future design directions
Most importantly, it provided a defensible foundation for designing a Depot Stock View that balances consistency, flexibility, and role-specific relevance across multiple business functions.

